Observability Is Also Context for AI Agents
This is the third article in a series about AI-friendly architecture. We have already talked about how AI is like a new person joining a company and how important it is to connect code, documentation, and architectural decisions.
Now I want to talk about a source of context that is often treated only as an operations tool: observability.
The Real System Is Not Only in the Repository
When we look at a system through its code, we see a picture of what was built.
But the system running in production may tell a different story.
A configuration may have changed. A dependency may be slower. A certain flow may be used much more than the team expected. A rule may work correctly in most cases but fail with a specific combination of data.
Code shows what should happen. Observability helps us understand what is really happening.
This difference matters to both people and AI agents.
Observability Is Not Just Monitoring
Monitoring usually answers a simple question: is something wrong?
Observability tries to answer a bigger question: why is the system behaving this way?
To do this, we use different signals:
logs show events and details about an execution;
metrics show trends, volumes, and changes;
traces show the path of a request across different services;
deployment events show when a change went to production;
business data shows the impact on people using the system.
Each signal explains one part of the system’s behavior. When these signals are connected, it becomes easier to create a possible explanation and check if it makes sense.
Where Each Part Lives
Just as documentation does not need to be inside the code, observability data does not need to be stored in the repository.
The service creates events and signals. An instrumentation layer collects these signals. The observability platform stores and connects the data. Documentation explains the meaning of important metrics, alerts, and flows.
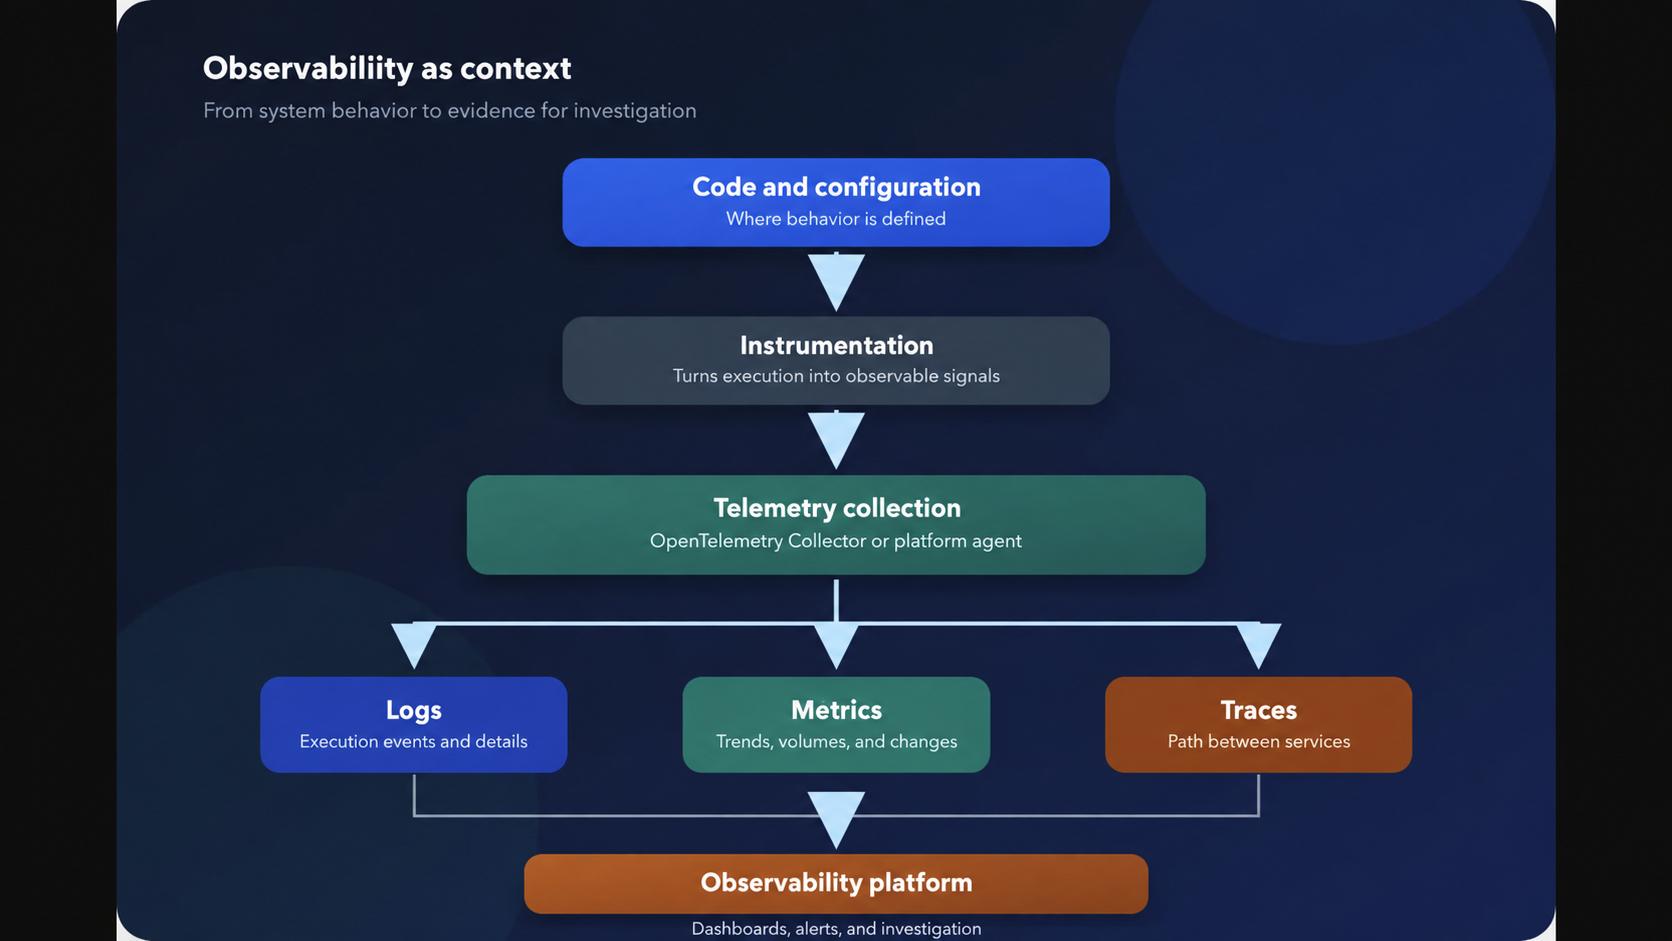
The repository can keep only the instrumentation settings, the names of the signals, and links to dashboards and runbooks. The data history stays in the operations platform, which is the right place to check how the system behaves over time.
The important thing is to connect these sources. An agent must be able to leave the service in the repository, reach the right dashboard, and find an explanation of what it is seeing.
An Incident Is a Context Investigation
Imagine that an API’s latency starts to increase.
An experienced person may know exactly where to look. They know the right dashboard, remember a similar incident, and know which service usually causes this type of problem.
A new person does not have this knowledge. An agent does not have it either.
To investigate the problem, they need to find a sequence of clues:
When did the problem start?
Which service showed the first signal?
Did the increase affect all users or only one flow?
Was there a deployment or configuration change during this time?
Which dependency started responding more slowly?
Did the increase in latency affect any business metric?
One dashboard cannot answer all these questions. They require information from different sources.
That is why observability is also context. It gives us evidence about how the system behaves in a specific situation.
Logs Need to Tell a Story
A log with a short message may help someone who knows the code. For a larger investigation, it is usually not enough.
Compare these two examples:
Error processing payment
{
  "event": "payment_processing_failed",
  "order_id": "ord_123",
  "payment_provider": "provider_a",
  "error_code": "timeout",
  "retry_count": 2,
  "request_id": "req_456",
  "occurred_at": "2026-08-20T18:30:00Z"
}
The second example is better because it contains information that can be connected to other signals.
With a request_id, we can follow the request across different services. With an order_id, we can understand the impact on one transaction. With the error code, we can group similar failures. With the timestamp, we can compare the event with deployments and infrastructure changes.
Structured logs make the system’s behavior easier to understand.
Metrics Need to Have Meaning
It is possible to have many dashboards and still have poor observability.
A metric is useful only when we know what it means, what behavior it describes, and when we should pay attention to it.
For example, a metric called request_count may show the number of requests. But we also need to know:
what the time unit is;
which service creates this metric;
which filters are available;
what change is considered normal;
how it relates to errors and latency.
Without this context, an agent may find the right metric and still understand it incorrectly.
A good practice is to document the most important metrics with their meaning, dimensions, and known limits. The dashboard becomes a visual explanation of the system.
Traces Connect Architecture to Behavior
In a distributed architecture, a request may pass through several services before reaching the user.
When we look at each service separately, we lose part of the story. A trace lets us follow the full path and see where time was spent.
This helps answer questions such as:
which service added the most latency;
which call was repeated several times;
where the first error happened;
which external dependency is affecting the flow;
whether a failure in one service is causing problems in others.
For an agent, traces connect the architecture map to a real execution. They show how the components worked together, not only how they were described in a document.
Operational Context Must Include the Business
One common mistake in observability is looking only at the technical health of the system.
CPU, memory, error rate, and latency are important. But they do not always show the real impact on the people using the product.
An API may return a successful response while an important business step is failing. A flow may have few errors but affect the most important customers. A queue may be processing messages but with a delay that creates a bad user experience.
Because of this, it is useful to connect technical signals with business events:
approved payments;
completed orders;
processed documents;
users who completed a step;
transactions that needed manual help.
This context helps the agent focus on what really matters. Not every technical alert is a business incident, and not every business problem appears as an obvious technical error.
What Happens After a Deployment?
A code change can only be properly evaluated after it starts running.
The context of a change should also include its connection to production signals. When a deployment happens, we should be able to answer:
which services changed;
which metrics need to be watched;
what behavior we expect;
which alerts may show a problem;
how to compare the old behavior with the new behavior.
With these connections, an agent can help not only write a change but also check whether it produced the expected result.
How to Prepare Observability for Agents
You do not need to instrument everything at once. It is better to choose one important flow and make it easy to understand from start to finish.
These steps can help:
Choose a flow that matters to the business.
Make sure it has a correlation ID.
Structure the main logs for this flow.
Create metrics with clear names and meanings.
Check that traces pass through the services involved.
Connect deployments, incidents, and configuration changes.
Document what is normal and what shows unusual behavior.
The goal is not only to create better-looking dashboards. The goal is to build a system that can tell its own story when something changes.
Conclusion
Observability is one of the most important ways to give context to AI agents.
Code and documentation explain how the system was designed. Logs, metrics, and traces show how it behaves when people are really using it.
When these signals are structured, connected, and linked to business context, a new person or an AI agent can investigate problems with less help from people who already know the system.
In the next article, I will talk about skills. The idea is to understand how to give an agent the right context for each problem, with specialized skills for observability, delivery, data, and other technical areas.